logo

Core


What Difference a Year Makes: One Year Since U100’s Innovation Upgrade

03 Nov 2025
What Difference a Year Makes: One Year Since U100’s Innovation Upgrade

Innovation never stands still, and neither should the benchmarks designed to measure it. One year ago, the Global X U.S. 100 Index (U100 Index) methodology was upgraded to capture a broader and more accurate picture of American innovation1. Tracked in Australia by the Global X US 100 ETF (ASX: U100), the index now spans both NASDAQ and NYSE-listed companies, introduces an innovation filter based on measurable research & development (R&D) activity and intangible asset productivity, and applies a refined weighting structure to reward genuine innovation rather than inherited scale. Twelve months on, the results have made a strong case for that evolution.

Key Takeaways

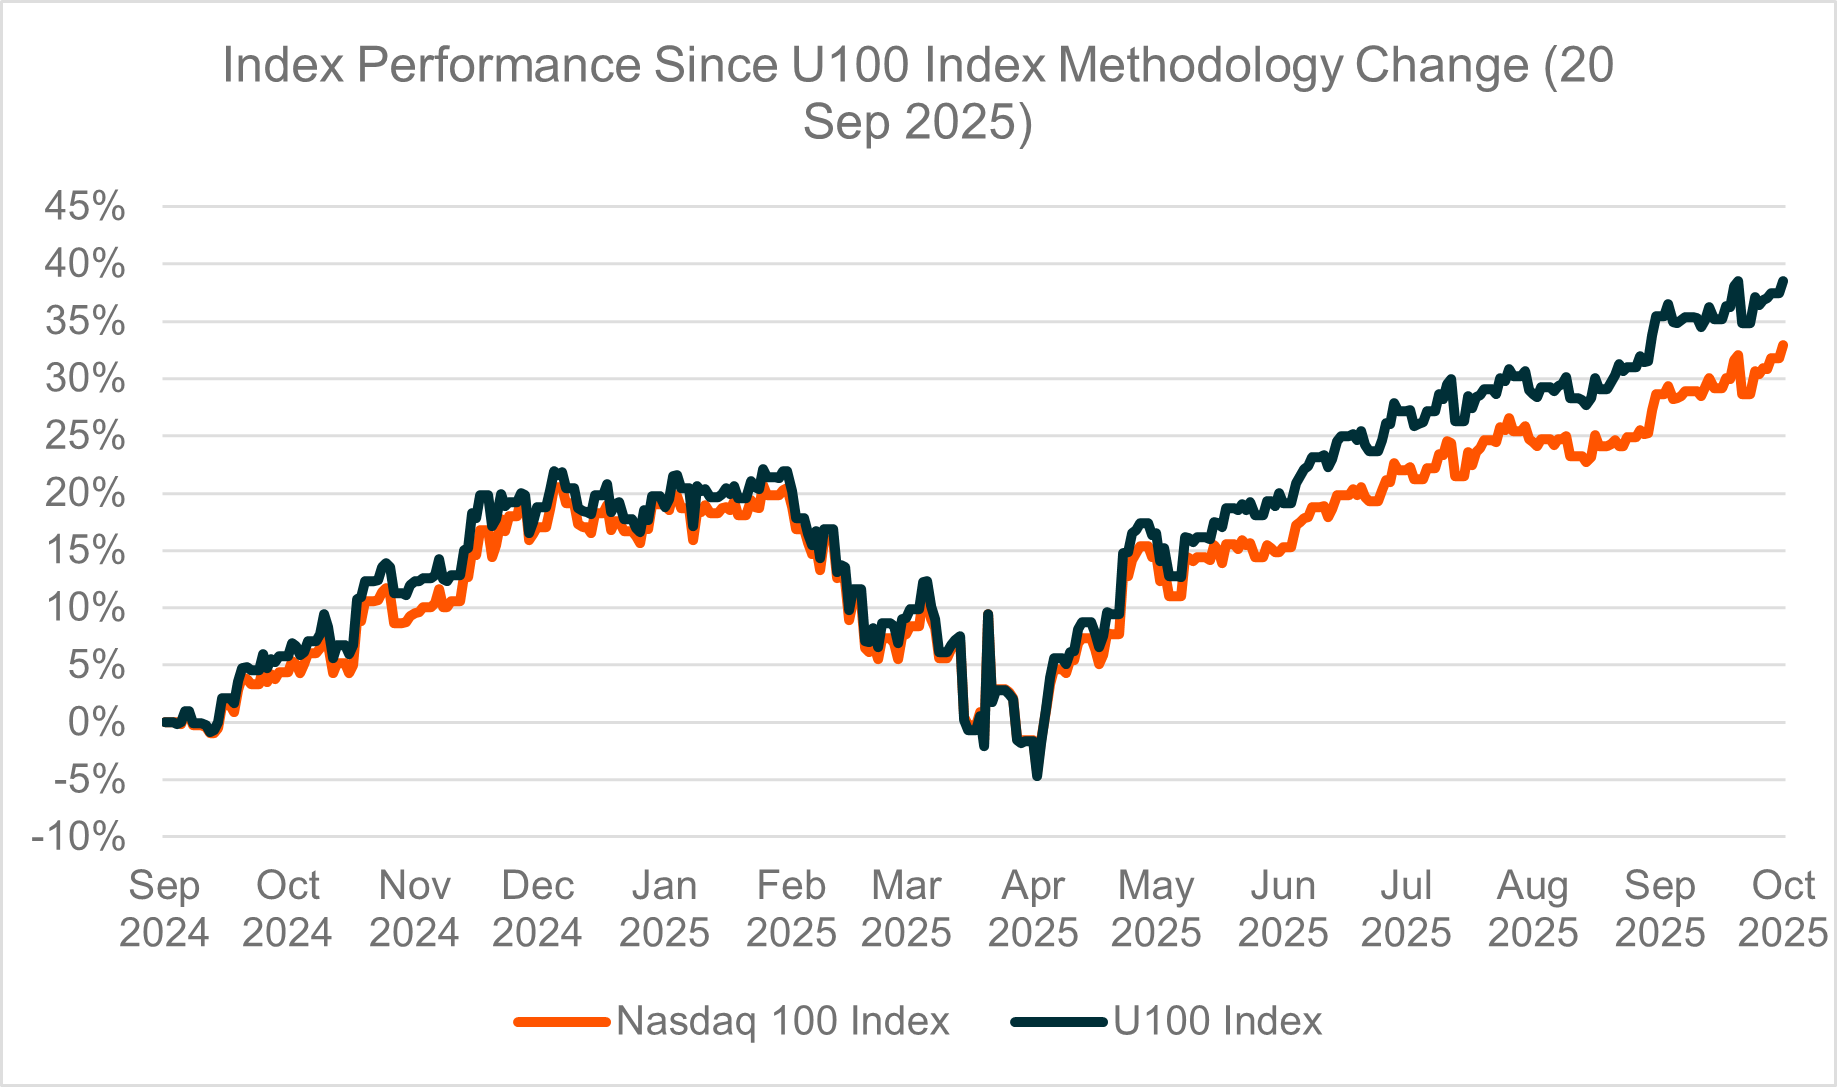
  • U100’s Index has outperformed key US large-cap innovation benchmarks such as the Nasdaq 100 Index by around 5% since the September 2024 methodology upgrade2.
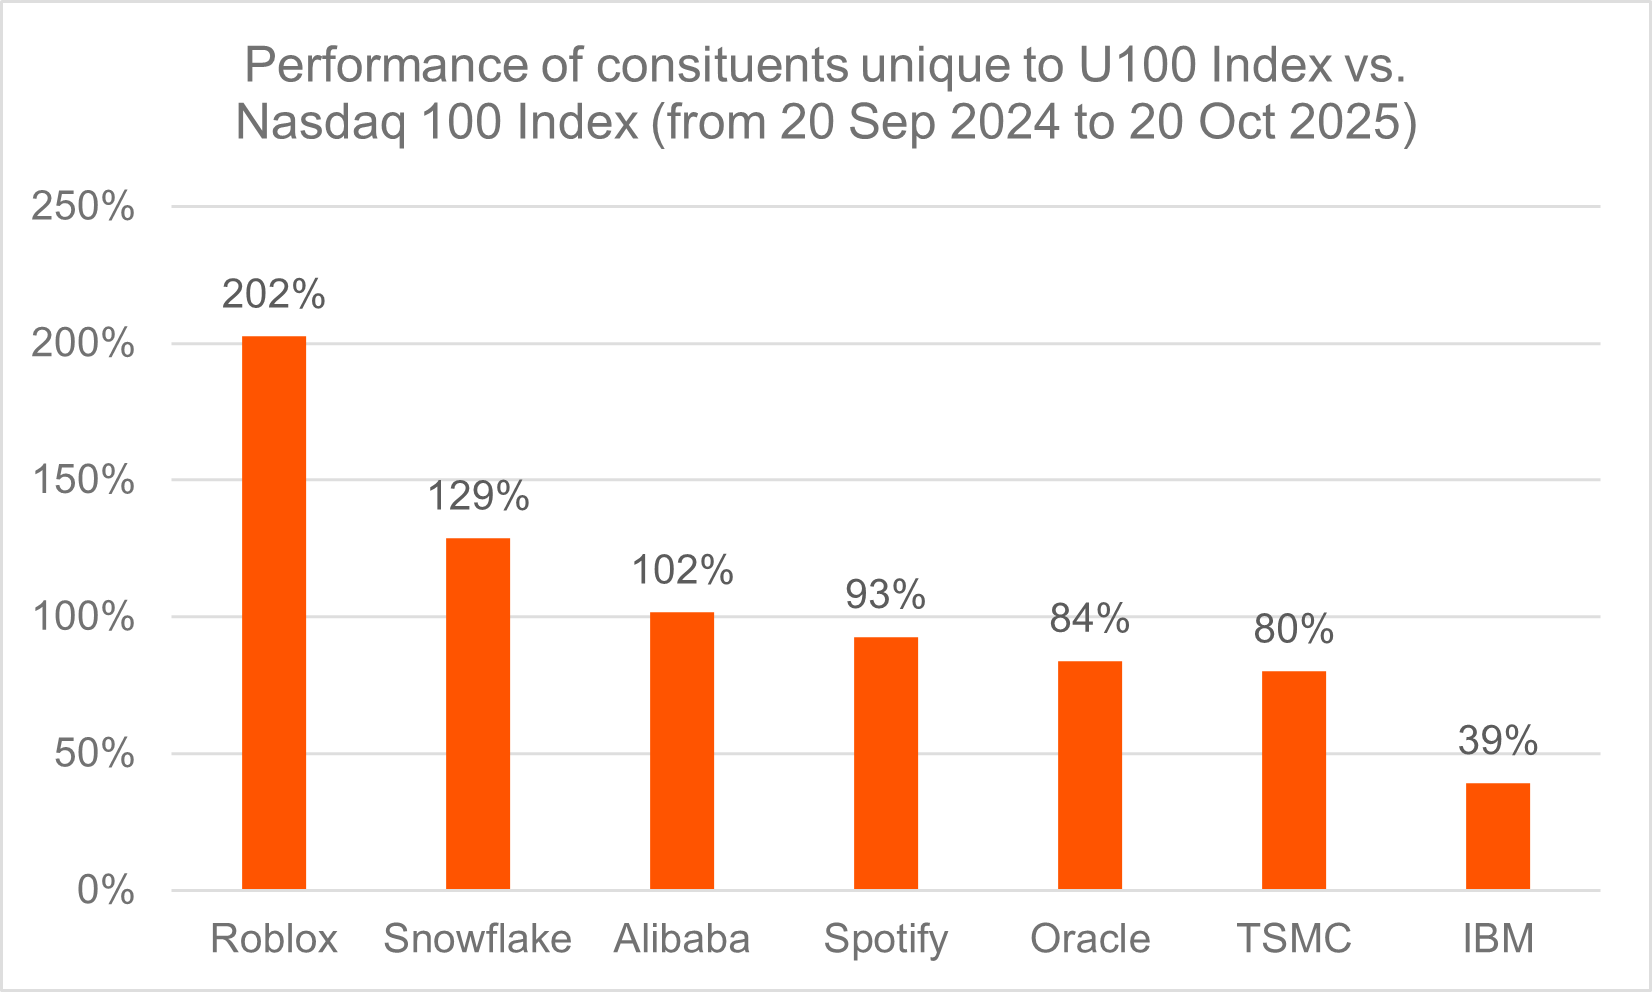
  • Unique inclusions such as Oracle, Taiwan Semiconductor, IBM and Snowflake led the gains, supported by renewed capital investment and AI-related demand.
  • The innovation filter and balanced weighting design delivered broader participation and a cleaner expression of true innovation leadership.

Re-engineering a Benchmark for Real Innovation

The 2024 methodology change was driven by a simple observation: technology leadership had outgrown traditional definitions. Innovation was no longer confined to software platforms but extended to semiconductors, data infrastructure, automation and intelligent systems. By expanding the universe to include both NASDAQ and NYSE-listed companies, U100 captured that evolution and re-established what an innovation index should represent.

The innovation filter sits at the core of this design. To qualify, companies must demonstrate measurable reinvestment through either a positive R&D-to-sales ratio or productivity from intangible assets. This simple rule separates firms that build from those that merely own. It shifts exposure away from legacy names with slower product cycles toward those funding the next phase of industrial and digital transformation.

Index Performance Since U100 Index Methodlogy Change (20 Sep 2025) Source: Bloomberg data as of 27 October 2025

How Selection Became Performance

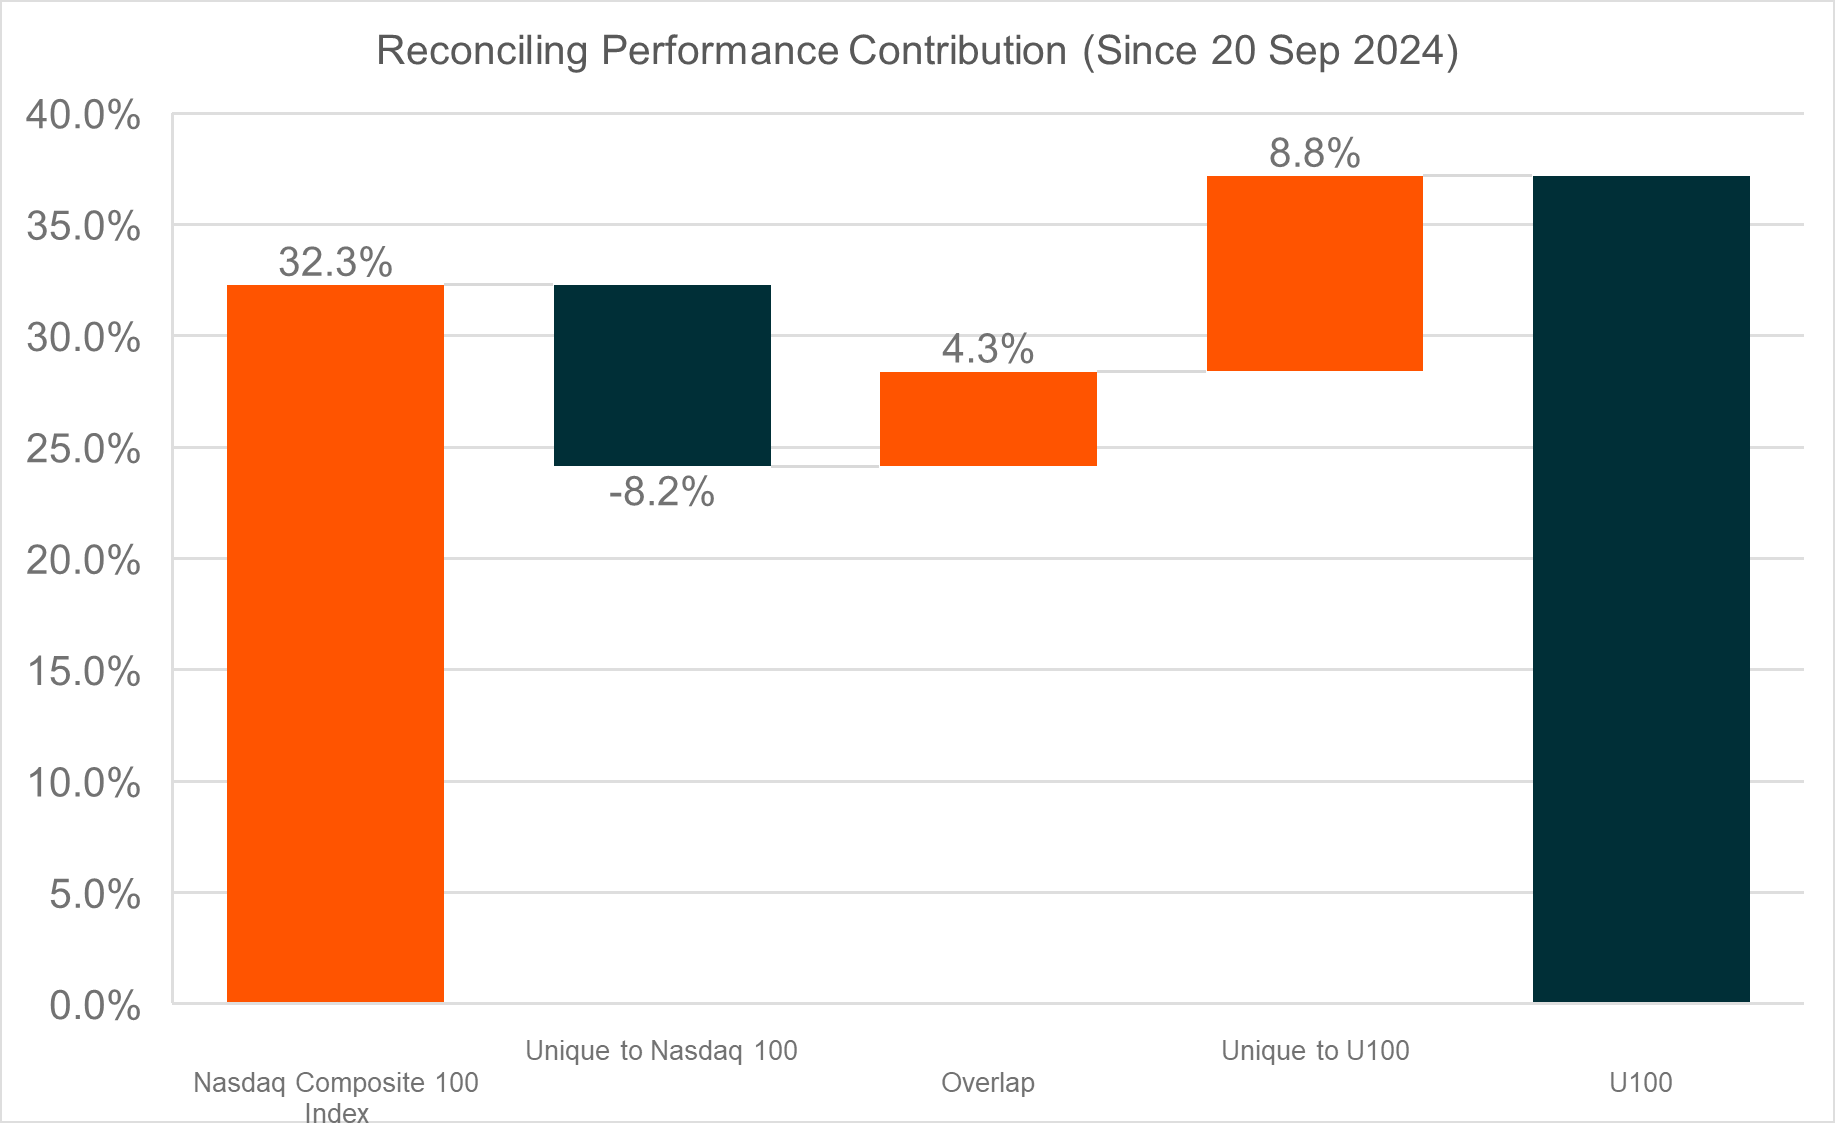
Since its methodology upgrade, the U100 Index has returned approximately 37% compared to around 32% for the broader large-cap technology index of Nasdaq 1003. The drivers of that outperformance were neither random nor cyclical. They were the result of selection discipline and measurable innovation.

Reconciling Performance Contribution Since 20 September 2024 Source: Bloomberg data as of 27 October 2025

Oracle was a standout, benefiting from sustained cloud demand and the rapid adoption of AI-driven data platforms. Taiwan Semiconductor’s continued dominance in advanced chip manufacturing captured a surge in global semiconductor investment, while IBM delivered solid returns through its pivot to hybrid cloud and enterprise automation. Snowflake and Roblox also contributed, reflecting the breadth of innovation now represented within U100 Index’s framework, from data infrastructure to digital engagement.

Performance of constituents unique to U100 index vs. Nasdaq 100 Index (from 20 Sep 2024 to 20 Oct 2025) Source: Bloomberg data as of 27 October 2025

Together, these names illustrate how U100’s Index methodology succeeded in identifying companies reinvesting in technology and scaling new revenue drivers rather than simply maintaining legacy businesses. The result was an index that not only outperformed but did so for the right reasons by capturing innovation where it is being built, not where it used to be.

From Concept to Proof

One year on, the U100 Index relative performance confirm that innovation leadership can be measured and rewarded through structure rather than speculation. The combination of a broader universe, measurable innovation criteria and disciplined weighting has produced an index that more accurately reflects where value creation is happening in the US economy.

For Global X, the U100 Index reflects a shared philosophy of building beyond ordinary, recognising that thoughtful index design can help investors align with the real engines of progress. The companies driving this change are not only coding software or fabricating chips, but also powering energy systems, digitising industries and building the infrastructure that underpins the AI era.

As the U100 Index marks its first year since the upgrade, the evidence is clear. When innovation is defined by reinvestment and results, the outcome is stronger performance and a truer picture of technological leadership. The index demonstrates that the best way to follow innovation is to keep moving with it.

Footnotes
Subscribe

All of Global X news and product announcements directly to you

*
*
*
*

We adhere to a strict Privacy Policy governing the handling of your information. And you can, of course, opt-out any time.

Material on this website is general in nature only, and does not take into account your personal objectives, financial situations or needs. Before making an investment decision, you should consider the information on this website and seek professional financial advice to assess whether a product is appropriate for you, and obtain and consider the Product Disclosure Statement (PDS) and Target Market Determination (TMD) for the relevant Fund, available from www.globalxetfs.com.au/funds or by calling + 61 2 8311 3488. You can also obtain a disclosure document by emailing info@globalxetfs.com.au. The information on this website has been prepared by Global X Management (AUS) Limited (ABN 13 150 433 828, Australian Financial Services Licence Number 466778) ("Global X") as product issuer of all products on this website except for Global X Physical Gold (GOLD), Silver (ETPMAG), Platinum (ETPMPT), Palladium (ETPMPD) and Precious Metals Basket (ETPMPM) which are issued by and Global X Metal Securities Australia Limited, a corporate authorised representative of Global X (CAR No: 001274650) (MSAL). No company in the Mirae Asset Group (Mirae Asset Global Investments Co., Ltd and its subsidiaries, including Global X and MSAL), nor any of their respective directors, employees or agents, make any representation or warrant as to the currency, reliability, accuracy or completeness of the information or statement of opinion or any previous or subsequent material contained on this website. To the maximum extent permitted by law, no liability or responsibility is accepted for any loss or damage as a result of any reliance on any information on this website. The content on this website may not be reproduced, distributed or published by any recipient for any purpose. Investments in any Global X product are subject to investment risk, including possible delays in repayment and loss of income and principal invested. The value or return of an investment will fluctuate and an investor may lose some or all of their investment. Past performance is not a reliable indicator of future performance.

Disclaimer

This document is issued by Global X Management (AUS) Limited (“Global X”) (Australian Financial Services Licence Number 466778, ACN 150 433 828) and Global X is solely responsible for its issue. This document may not be reproduced, distributed or published by any recipient for any purpose. Under no circumstances is this document to be used or considered as an offer to sell, or a solicitation of an offer to buy, any securities, investments or other financial instruments. Offers of interests in any retail product will only be made in, or accompanied by, a Product Disclosure Statement (PDS) which is available at www.globalxetfs.com.au. In respect of each retail product, Global X has prepared a target market determination (TMD) which describes the type of customers who the relevant retail product is likely to be appropriate for. The TMD also specifies distribution conditions and restrictions that will help ensure the relevant product is likely to reach customers in the target market. Each TMD is available at www.globalxetfs.com.au.

The information provided in this document is general in nature only and does not take into account your personal objectives, financial situations or needs. Before acting on any information in this document, you should consider the appropriateness of the information having regard to your objectives, financial situation or needs and consider seeking independent financial, legal, tax and other relevant advice having regard to your particular circumstances. Any investment decision should only be made after obtaining and considering the relevant PDS and TMD.

This document has been prepared by Global X from sources which Global X believes to be correct. However, none of Global X, the group of companies which Mirae Asset Global Investments Co., Ltd is the parent or their related entities, nor any of their respective directors, employees or agents make any representation or warranty as to, or assume any responsibility for the accuracy or completeness of, or any errors or omissions in, any information or statement of opinion contained in this document or in any accompanying, previous or subsequent material or presentation. To the maximum extent permitted by law, Global X and each of those persons disclaim all or any responsibility or liability for any loss or damage which may be suffered by any person relying upon any information contained in, or any omissions from, this document.

Investments in any product issued by Global X are subject to investment risk, including possible delays in repayment and loss of income and principal invested. None of Global X, the group of companies of which Mirae Asset Global Investments Co., Ltd is the parent, or their related entities, nor any respective directors, employees or agents guarantees the performance of any products issued by Global X or the repayment of capital or any particular rate of return therefrom.

The value or return of an investment will fluctuate and an investor may lose some or all of their investment. All fees and costs are inclusive of GST and net of any applicable input tax credits and reduced input tax credits, and are shown without any other adjustment in relation to any tax deduction available to Global X. Past performance is not a reliable indicator of future performance.